Go-Skate was an exciting project developed with Sportunity for the Royal Dutch Skating Association (KNSB). The goal was to transform raw performance data from MYLAPS tracking chips into an engaging and insightful digital experience for ice skaters. My role spanned both UX design and front-end development, focusing on translating skater needs into intuitive interfaces for both a mobile app and a comprehensive web dashboard, ultimately launching a platform to help skaters better understand and improve their performance.
About Go-Skate
While MYLAPS ProChips provided a wealth of data, it wasn’t readily accessible or easy for skaters to interpret. The core challenge was twofold:
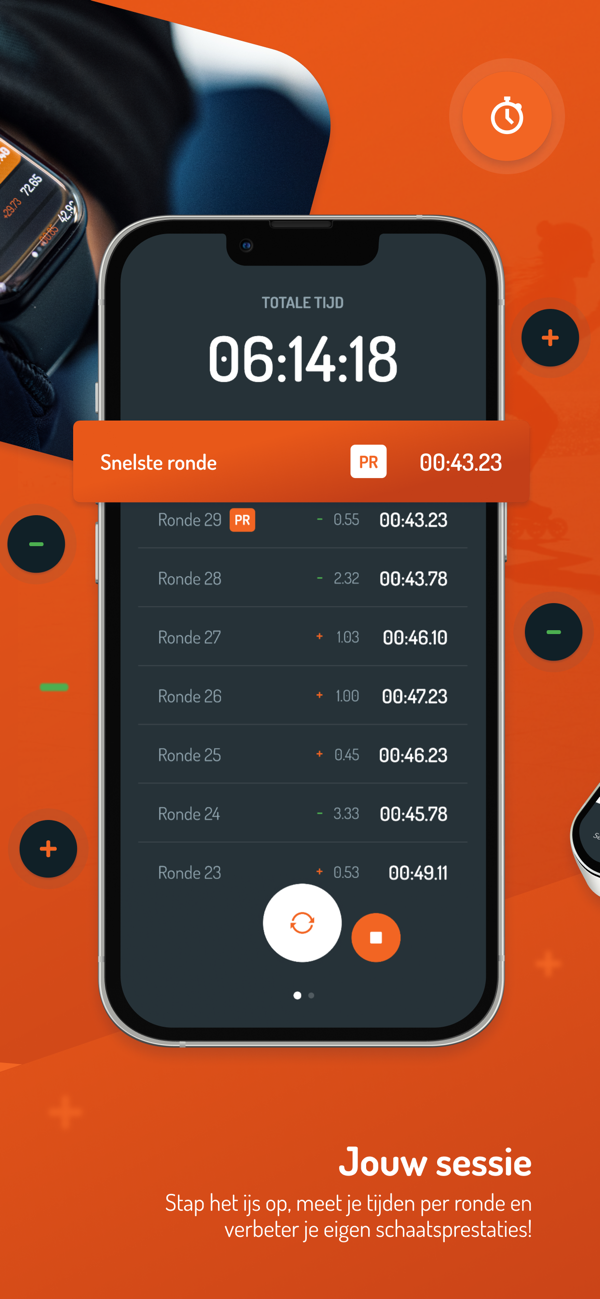
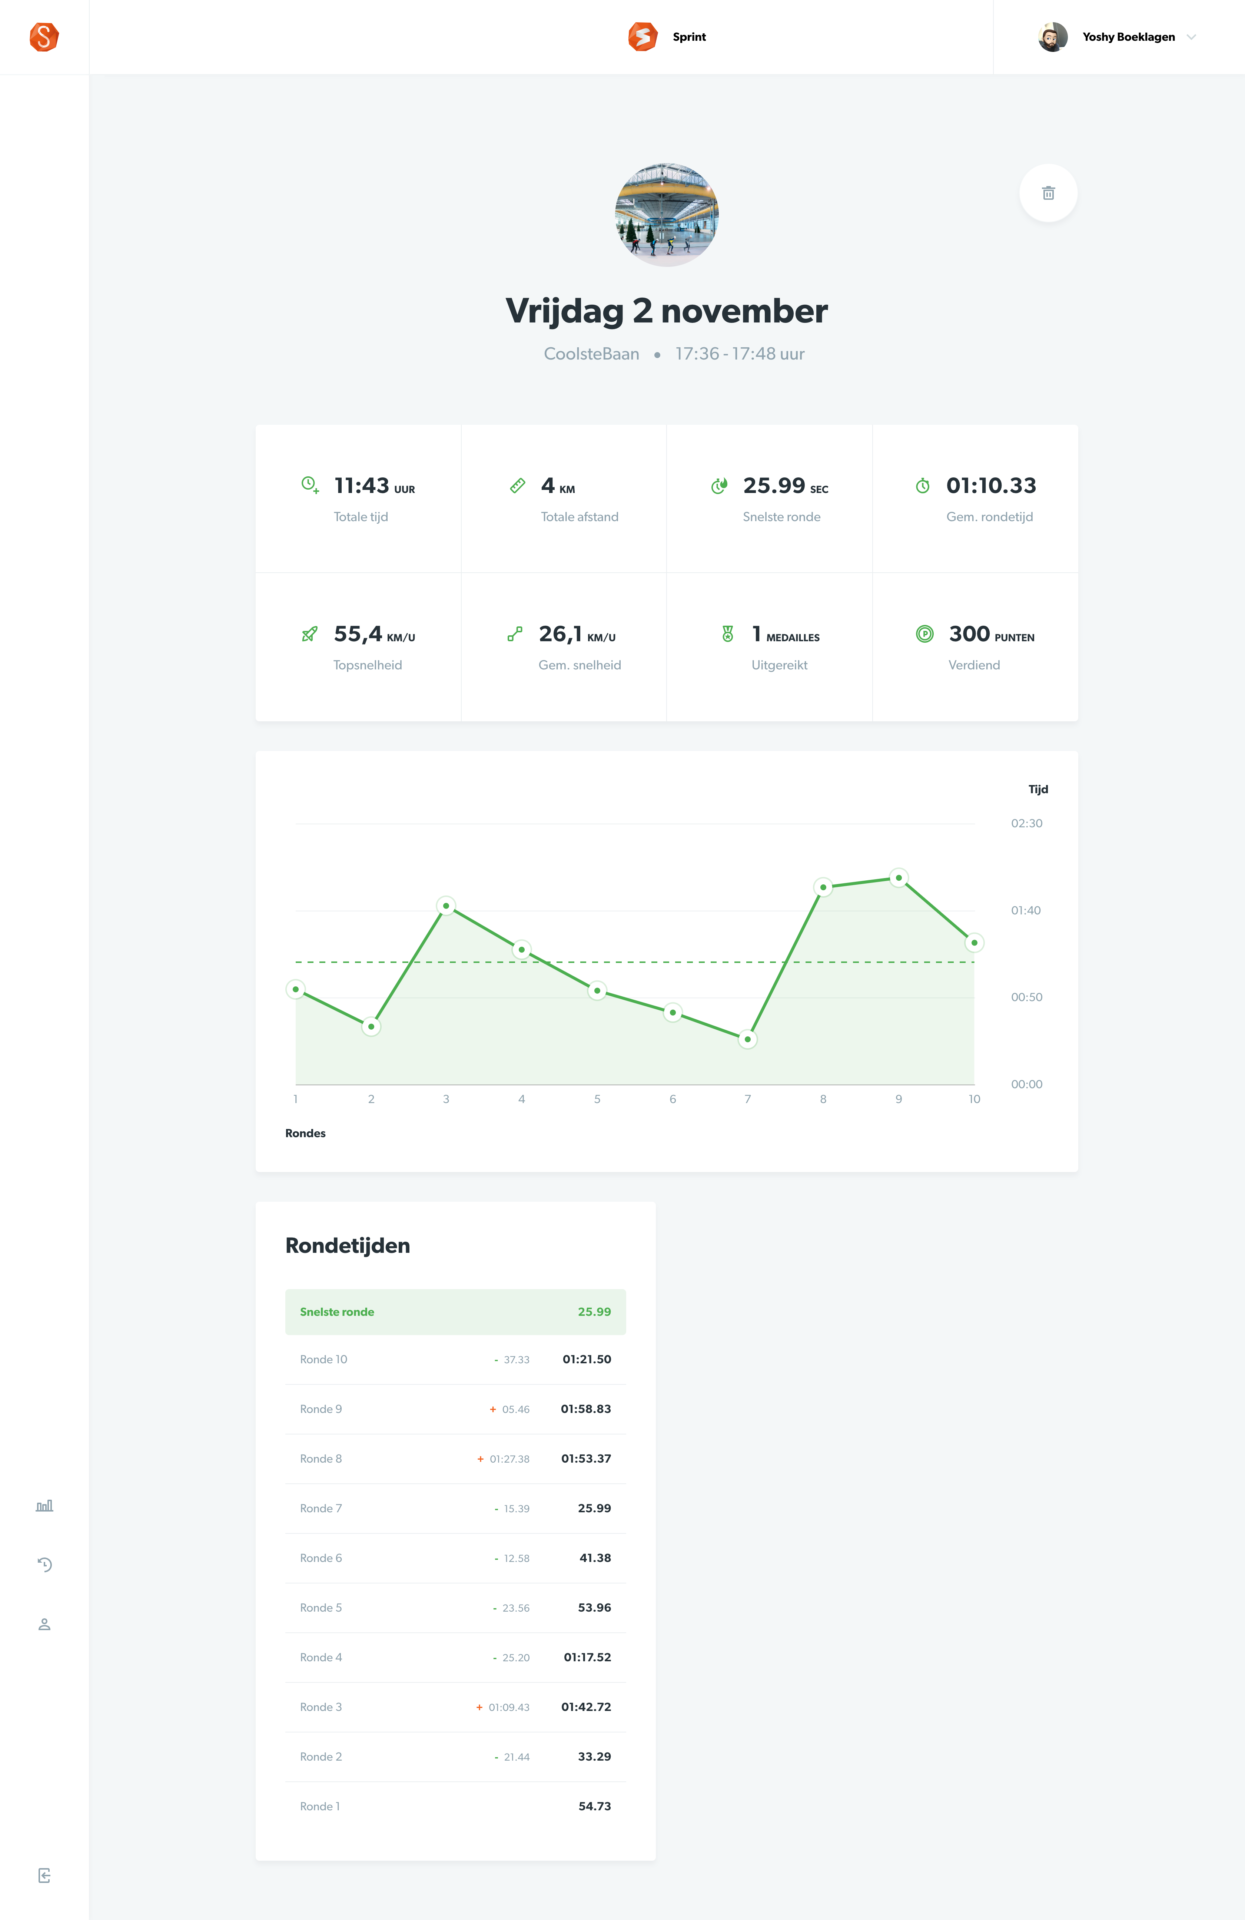
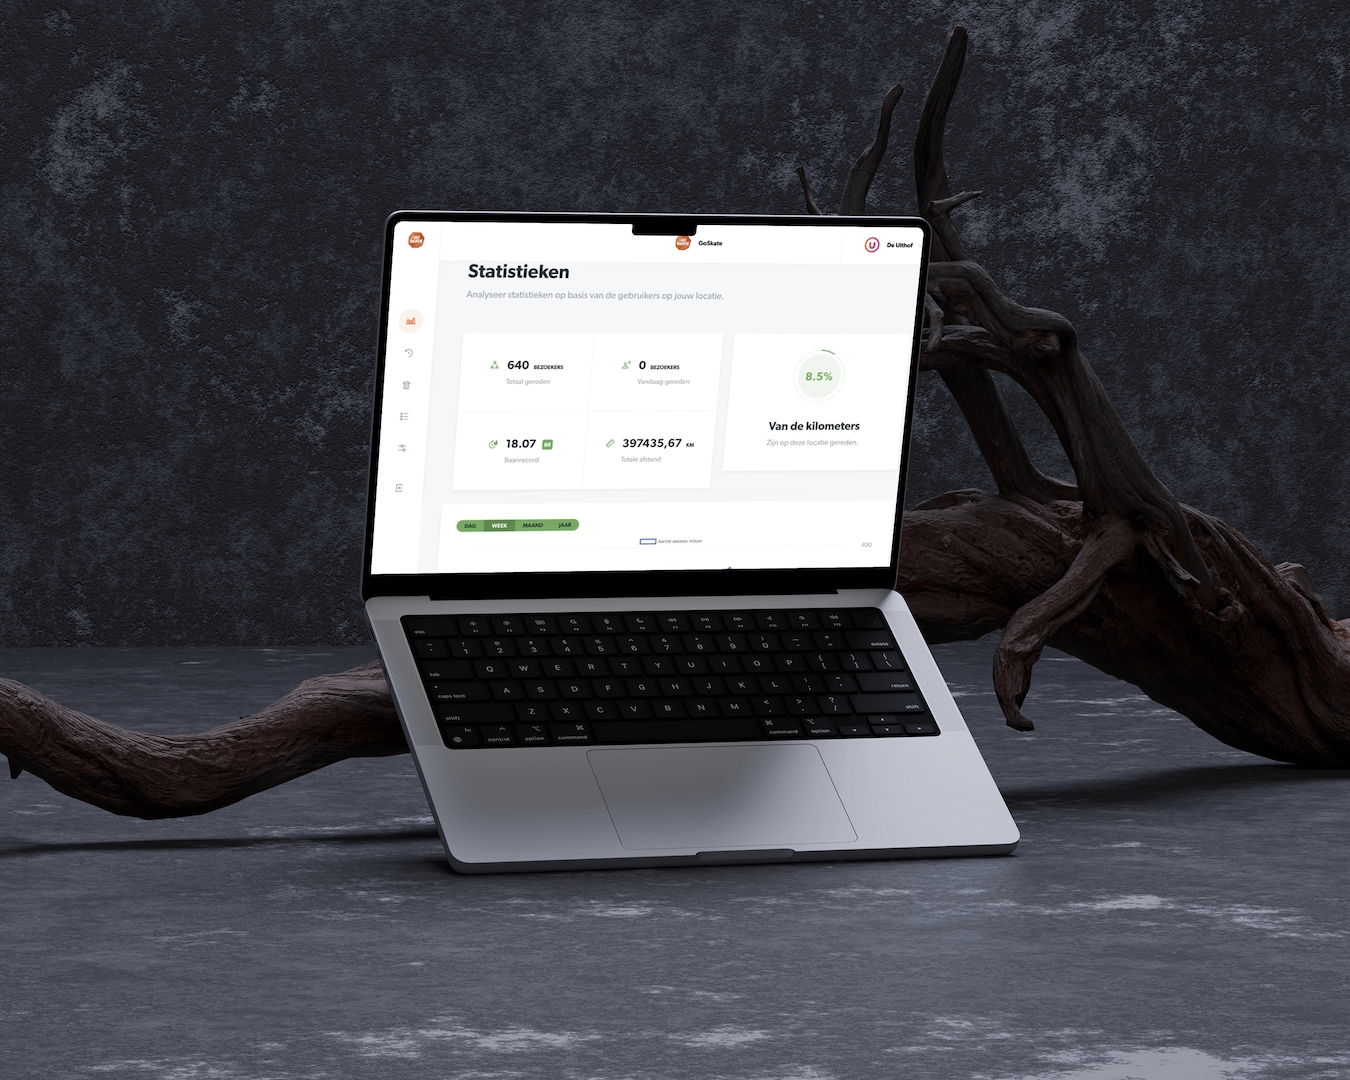
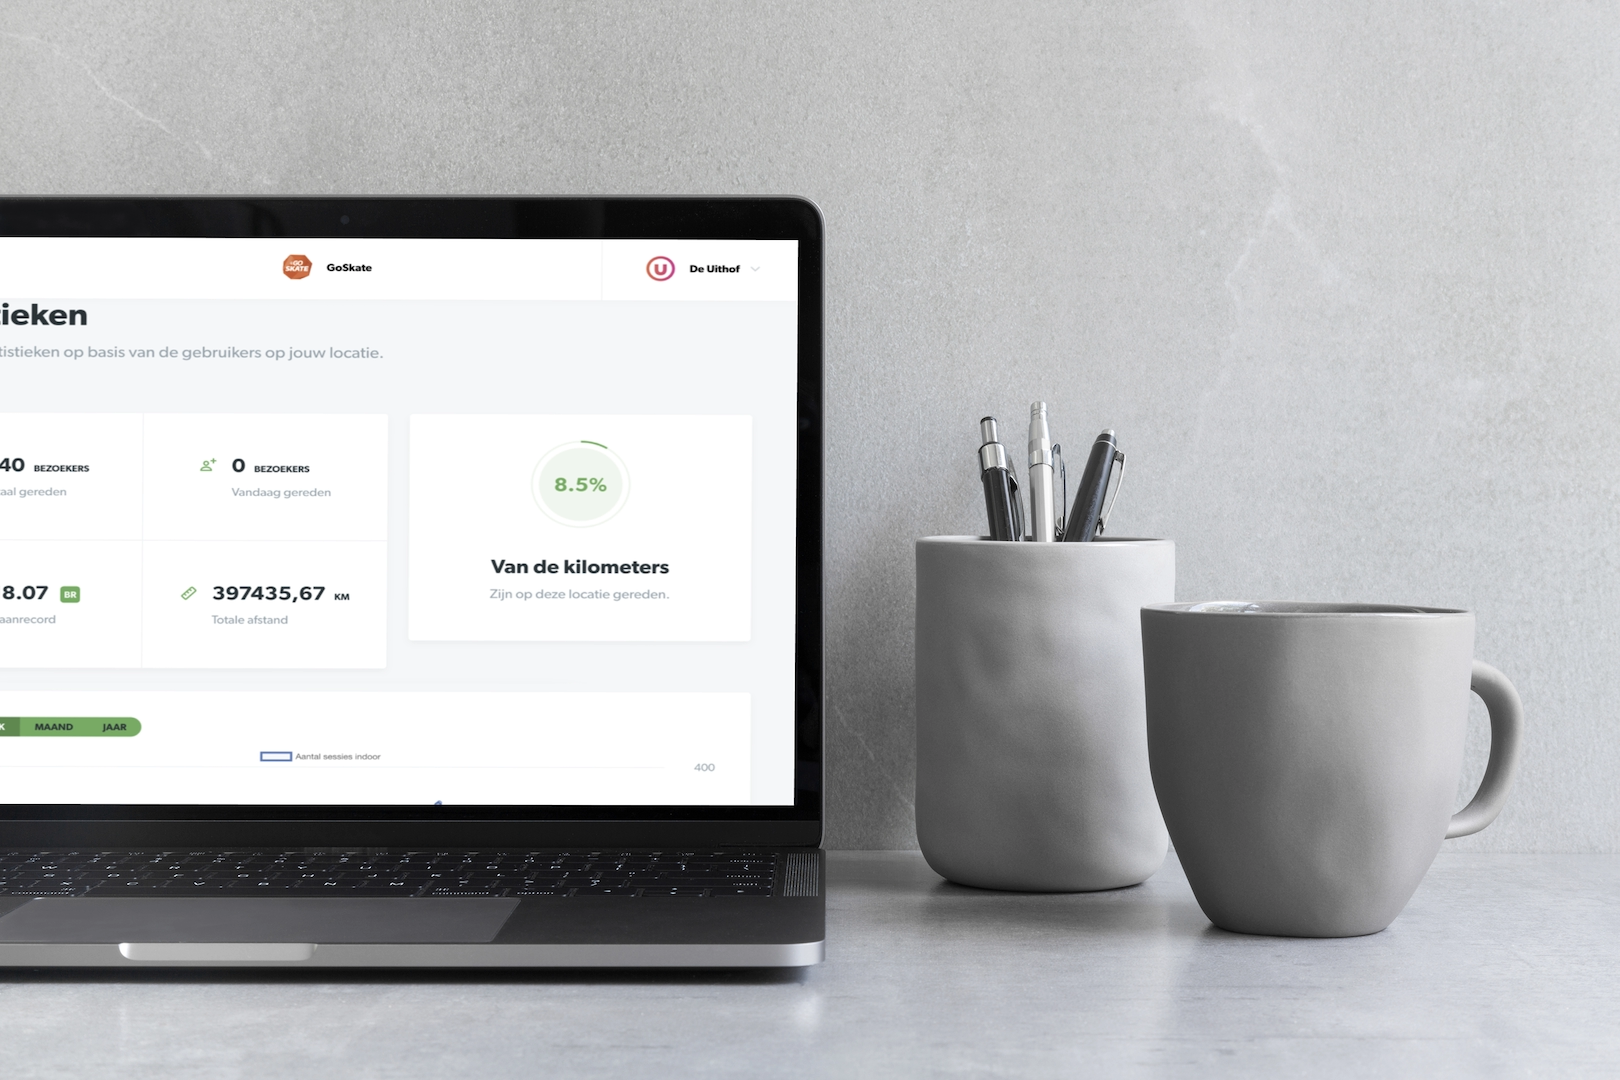
- Translate complex data: How could we convert raw metrics (lap times, speeds, distances) into clear, useful, and motivating insights?
- Understand the skater’s world: We needed to dive deep into the mindset of ice skaters – how they track progress, what motivates them, and what information they truly value – to design features that genuinely enhance their experience on and off the ice.
My role & responsibilities
Working within a small, dedicated startup team at Sportunity meant roles often overlapped. My primary responsibilities included:
- UX Design: Researching user needs, feature definition (using MoSCoW), creating wireframes, designing user interfaces in Sketch, building prototypes, and designing gamification elements like achievement badges.
- Front-End Development: Implementing the designs for the desktop application using VueJS, ensuring a functional and visually polished final product.
The process
Our journey started with the available data and a clear goal: build the best possible insight platform for skaters.
Discovery & feature definition: We began by analyzing the MYLAPS data capabilities. Crucially, we researched how skaters currently perceived their performance and what features they desired. This involved understanding their needs and wishes, which informed a comprehensive feature list prioritized using the MoSCoW method (Must have, Should have, Could have, Won’t have). This ensured we focused on delivering core value first.
Ideation & Design: Based on our research insights and prioritized features, we started ideating. This involved:
- Sketching initial screen concepts and data visualization ideas;
- Developing user flows for key tasks within the app and dashboard;
- Creating detailed wireframes to map out the structure and layout;
- Designing the final UI in Sketch, focusing on clarity and visual appeal suitable for sports enthusiasts;
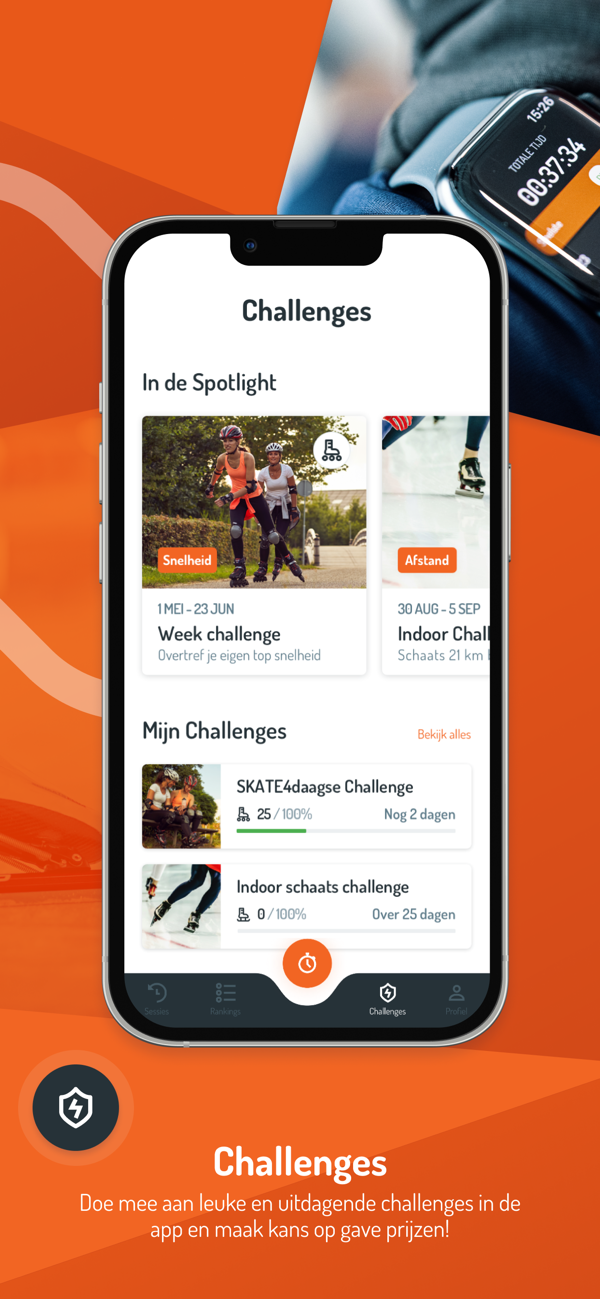
- Designing a series of badges to encourage engagement and reward milestones.
The tools used
Design & Planning: Sketch, Miro (for ideation/mapping), Jira (for project tracking), Pen & Paper
Development: VueJS, VueX, HTML, SASS, JavaScript
The result
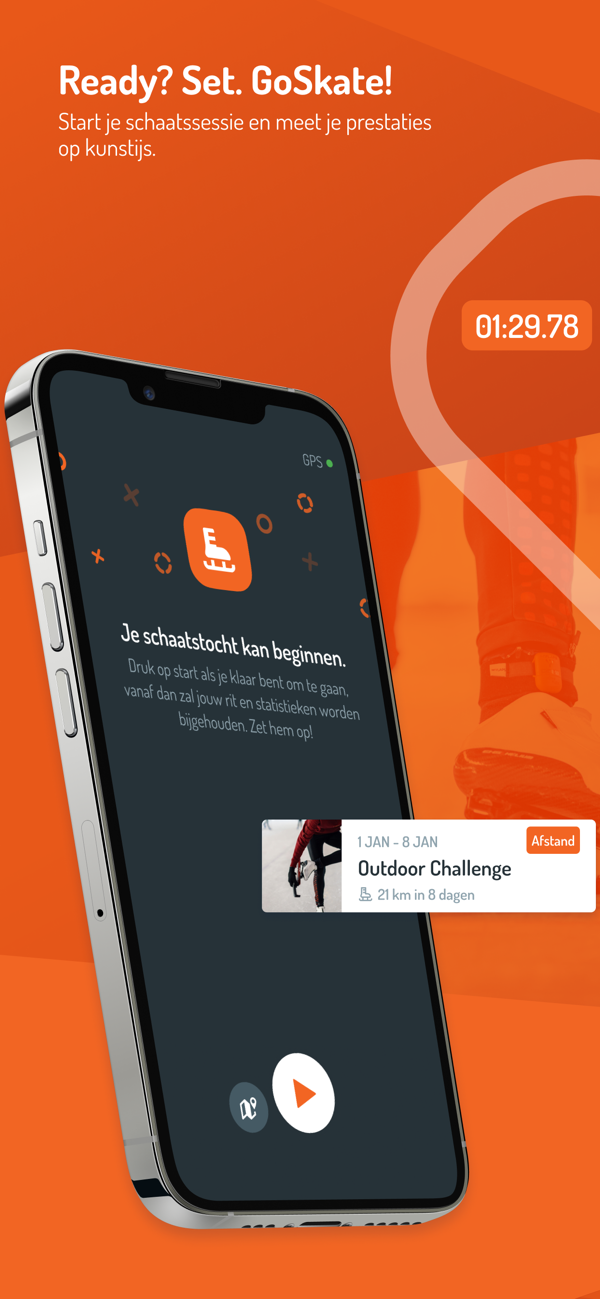
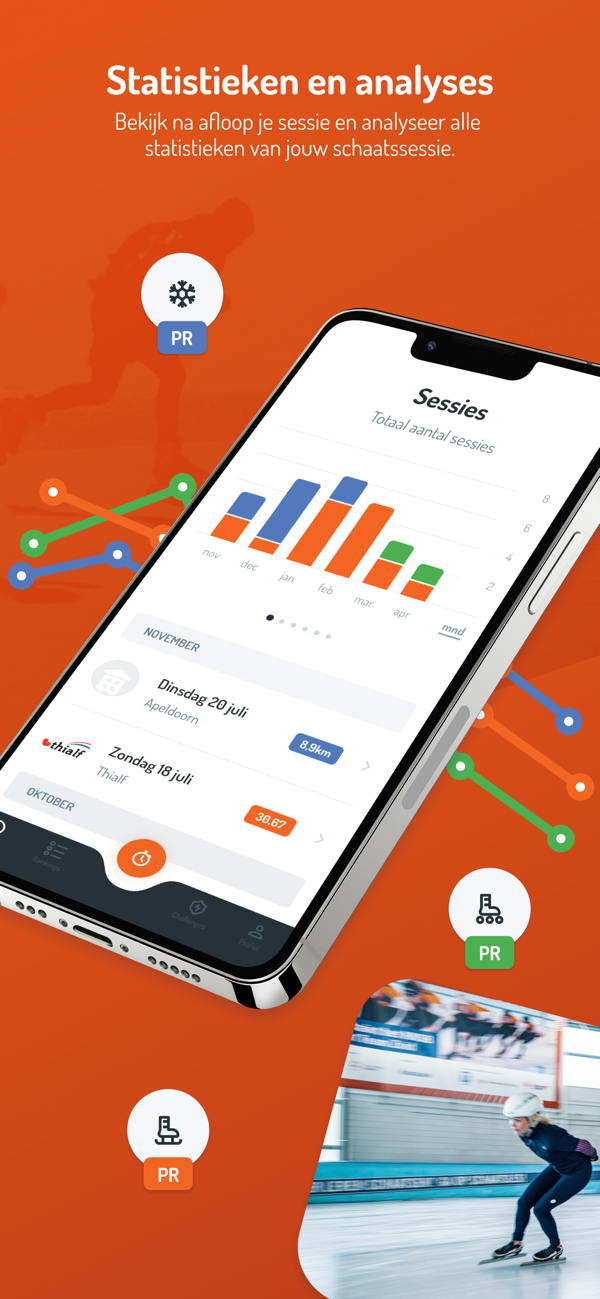
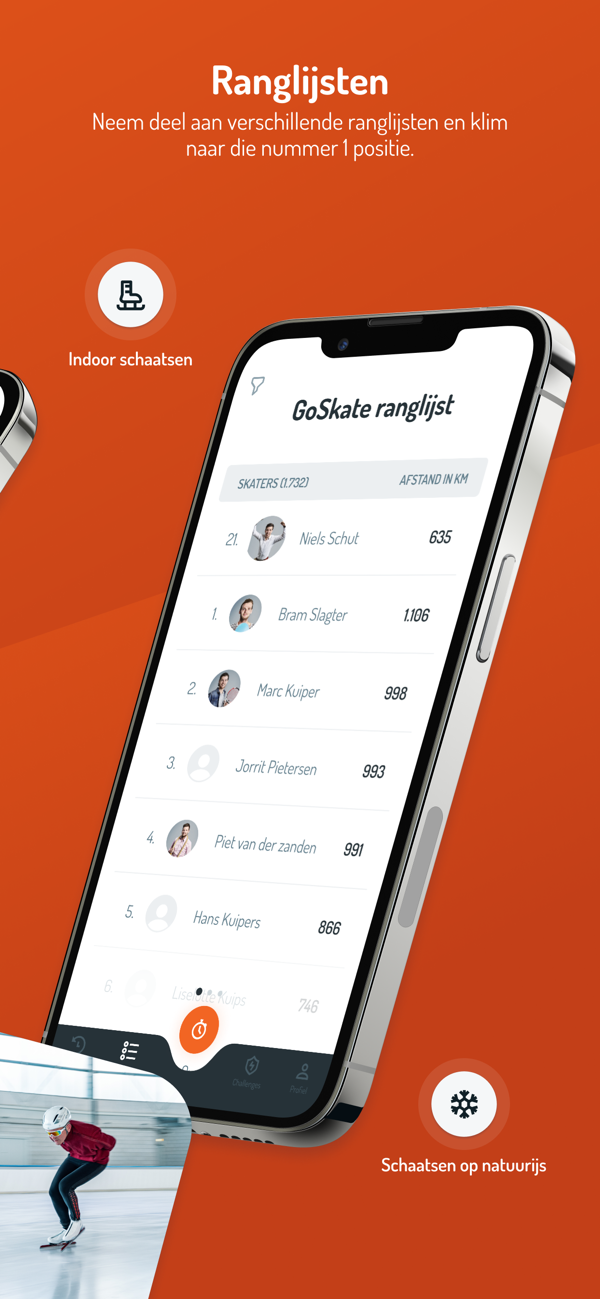
- Mobile App: Providing skaters with quick access to their most recent lap data, session summaries, and performance history on the go